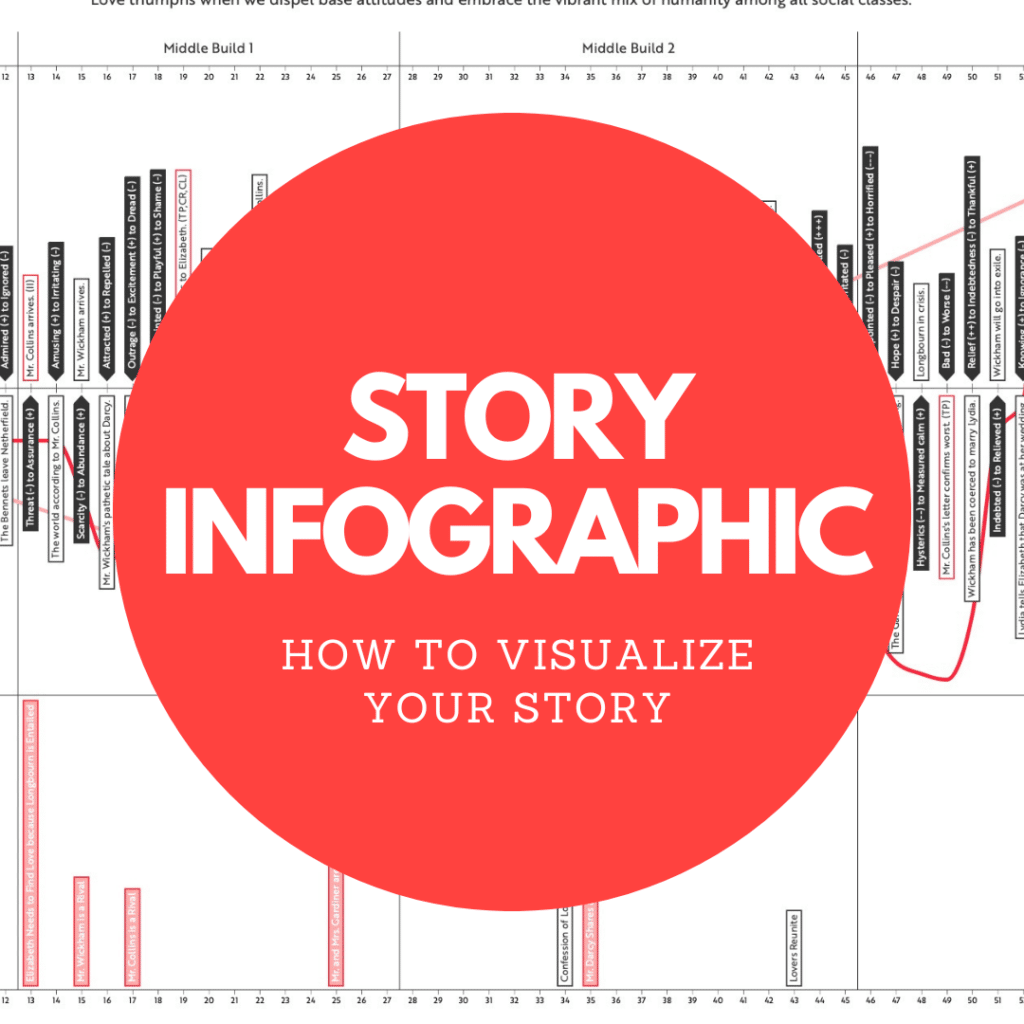
What is the Story Grid Infographic?
Dedicated story writers often want a visual understanding of the story arc they create for audience members so they can judge whether they are crafting the story experience they intend. Typically, they use Freytag’s pyramid or Aristotle’s plot mountain to see if their stories conform to story form.
At Story Grid, we understand that tools like these capture the movement of stories generally but ignore the intricacies of story arcs and don’t shed light on the specific kinds of stories we want to write. In other words, these forms don’t provide specific feedback to help us improve our stories and become better writers.
That’s why we use the Story Grid Infographic. The Infographic shows the incremental changes in value of our story scene by scene. Then we can see how our story moves from beginning to end. The Infographic also enables us to track other global elements to give us a high-level view of the story at a glance.
We can also compare our story’s Infographic to one of a MASTERWORK in our GENRE to see how well we are conforming to reader expectations.

What are the Key Features of Story Grid’s Infographic?
The Infographic includes two axes. The horizontal axis, where we list all the scenes of the story by number and description, and the vertical axis where we list the CORE VALUE gradient for the external and internal genres from positive to negative.
For example, the ACTION GENRE spans a gradient of value including life, unconsciousness, death, and a fate worse than death. The WORLDVIEW GENRE spans a gradient of value including sophistication, cognitive dissonance, naivete, and naivete masked as sophistication. The Core Value is the yardstick we use to measure how the change in a scene moves the CORE VALUES of the primary and secondary genres.
For each SCENE, we identify the following items.
- Story Event Summary: This summary is a concise (60 or fewer characters) statement of what happens in each SCENE. This enables us to remember what happens in the scene without having to refer to the manuscript.
- VALUE SHIFT. We describe the beginning value and ending values in the scene using specific terms, for example, afterthought to centerpiece or conscious to unconscious. We then identify how this equates to the movement in the external and internal CORE VALUE gradients.
We also identify the following global items in the Story Grid Infographic.
- CONTROLLING IDEA. This is the lesson or takeaway the ARTIST wants to convey through the story. This appears at the top of the Infographic because each scene in the story should be communicating this message.
- QUADRANTS. These are structural UNITS OF STORY that demonstrate the stages of development for an avatar through their ability to adapt to change in the global CONTEXT. We mark the quadrants on the Infographic to show which scenes contribute to the changes in the protagonist’s approach to the problem raised by the global INCITING INCIDENT.
- CONVENTIONS and OBLIGATORY MOMENTS. Genre Conventions create the conditions for specific change that occur in the Obligatory Moments of a story. Seeing where these GENRE must-haves occur helps us to see whether we are setting up and paying off reader expectations, and also to compare our story to MASTERWORKS of our CONTENT GENRE.
Generating the Story Infographic
The Infographic can be created by using any spreadsheet application, but the best and easiest way to generate it is by filling in the Story Grid SPREADSHEET template. By entering the specific story information in each cell of the spreadsheet template, you’ll automatically collect the data you need to create the Infographic.
Examples of the Story Infographic
Pride and Prejudice by Jane Austen:

The Wonderful Wizard of Oz by Frank L Baum:

The Infographic can be found by clicking the link and downloading the Infographic off of the page.
Additional Infographic Resources:
- The Story Grid: What Good Editors Know by Shawn Coyne
- Story Grid 101: The Five First Principles of the Story Grid Methodology by Shawn Coyne
- Story Grid Spreadsheet Template
- The Four Core Framework: Needs, Life Values, Emotions, and Events in Storytelling by Shawn Coyne
- Story Grid Infographic analysis of The Threshing by Tim Grahl