Have you ever wondered if you can apply the Story Grid to more than novels, screenplays, and non-fiction books?
What about the shortest form of storytelling that has the power to create the quickest impact on our emotions?
Songs.
Songs rarely tell a complete story from start to finish. Only some songs like ‘Welcome to the Black Parade’ by My Chemical Romance (5:10 min) or ‘American Pie’ by Don McLean (8:32 min) ever accomplished telling one full story in one song.
We are more familiar with concept albums on which the songs are connected by one central lyrical narrative, like on Green Day’s album “American Idiot”.
If you genuinely want to connect with your audience, use the craft of storytelling to hook your listeners, keep them engaged, and let them experience the ups and downs your character goes through in your song. Because when the lyrics resonate with the listener, a song can change their life.

Does the craft of powerful storytelling influence the success of an album?
People listen to songs because the lyrics express everything they’re trying to say.
Some songs merely capture a snapshot of a moment in time, but most songs can be considered like scenes or chapters of a larger story. And you can use the Story Grid to analyze songs in the same way as scenes.
Lyrics are important.
There’s a reason people say: This song saved my life.
Songs have the power to take you back in time and wake long-forgotten memories. They give you comfort whenever you’re down and pump you up when you’re excited.
Songs have the power to change lives and create meaning. That’s why it is essential to use the craft of storytelling for your songs.
Here are two case studies.
I’ve analyzed the storytelling in the lyrics of all 161 songs of Irish band Westlife as well as the seven studio albums (82 songs) of Placebo.
Here’s what I found out when I compared the overall worldwide album sales (green line) with the storytelling strength of each album (black line).
Westlife
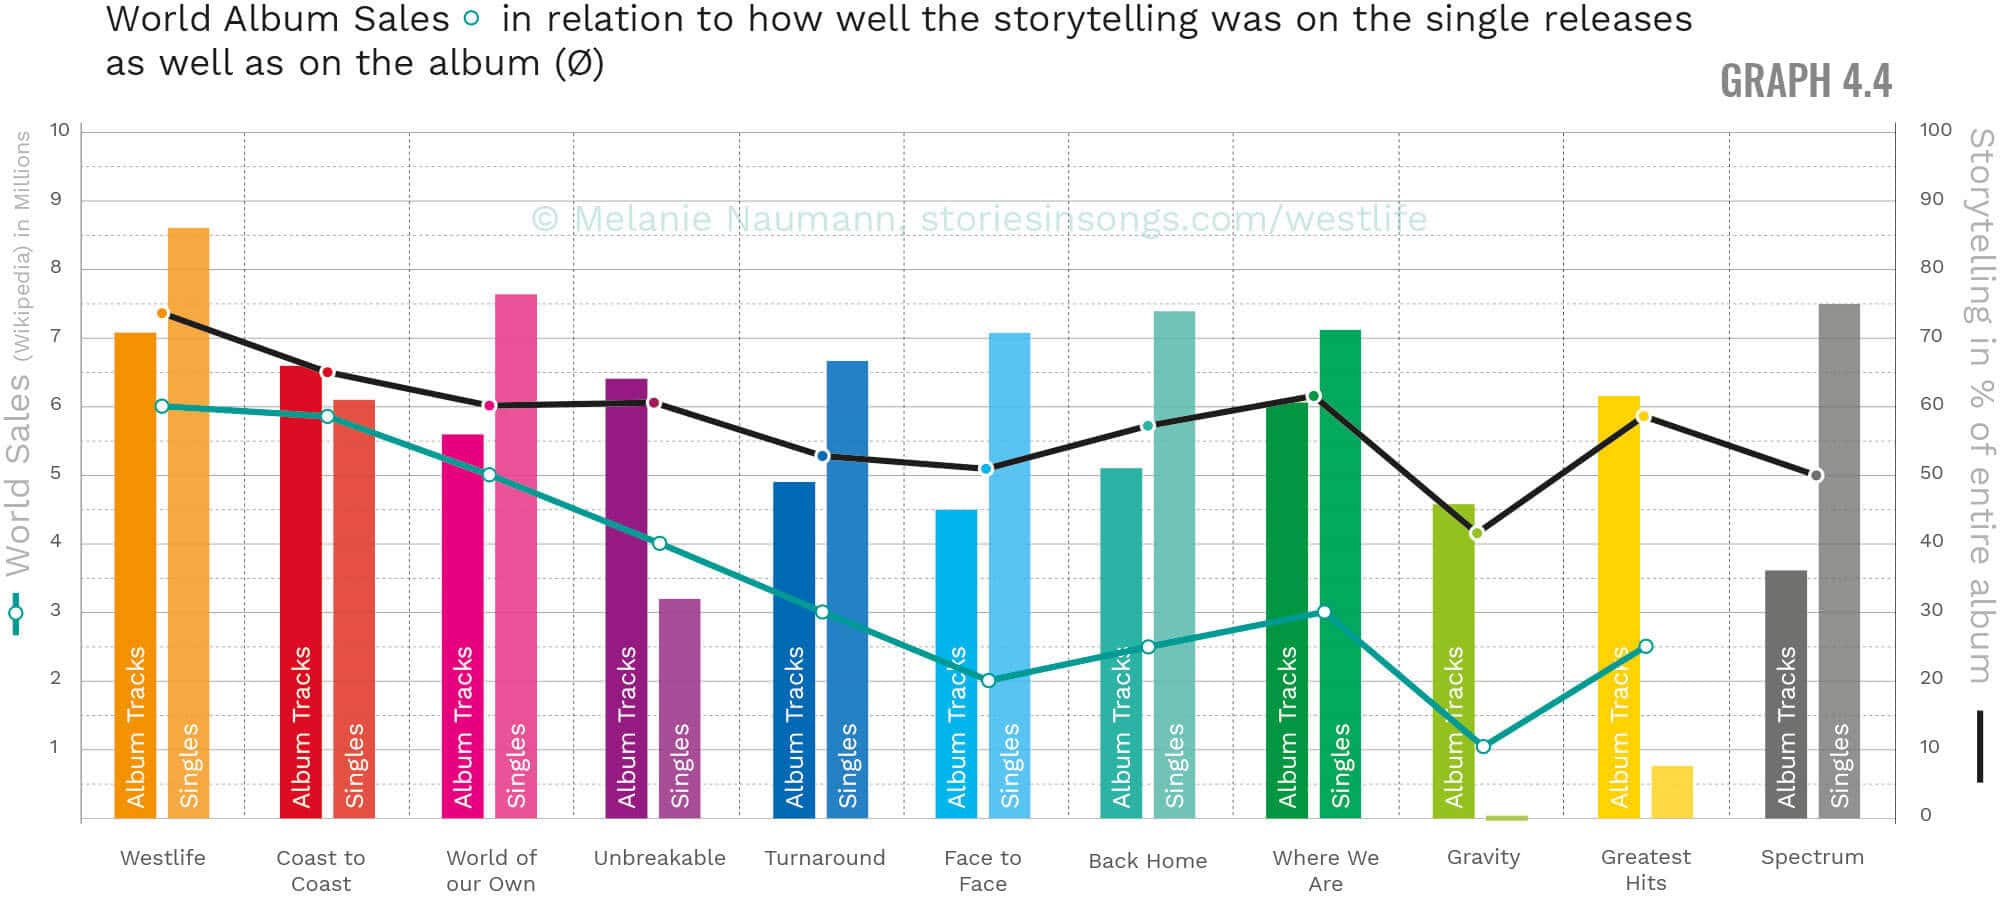
Info: Spectrum – No data yet since Westlife released the album in November 2019.
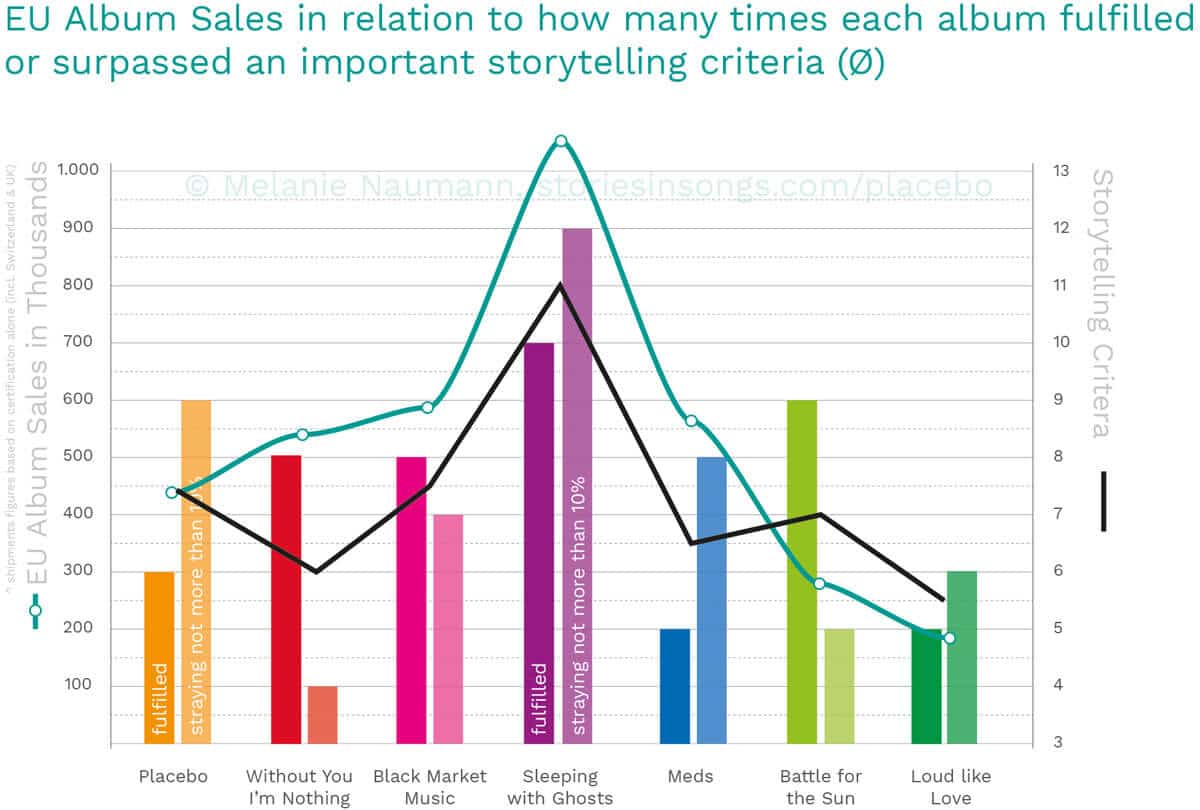
And here’s the same comparison for Placebo considering their European album sales:

There’s indeed a correlation between the number of sales and the storytelling strength of each album’s songs.
It’s obvious when you look at the parallel line of Westlife’s discography compared with their worldwide album sales.
I say more about Placebo later.
And at the end of this blog post, I will also tell you about something that I call the ‘Uniqueness Factor’.
This factor tells a band/musician exactly what their audience expects from the lyrics of their songs. This factor also shows why their highest-grossing album was more successful than the one with the lowest sales. It all comes back to their Uniqueness Factor and how well they delivered on it.
But for now, let’s focus on how you can use the Story Grid to analyze the strength of your lyrics.
The diagnostic of your story
If you’re familiar with the Story Grid, you know we offer the diagnostic of your manuscript to help you find out
- what your readers will expect from your story (genre, obligatory scenes, conventions)
- what the characters in your story want and need (objects of desire)
- who’s the best narrator for your story and why (point of view)
- we come up with a theme that wraps up how the story changes from the beginning to its ending
- and what the cause of that change was (value change).
- And most importantly, we determine if the backbone of your story is strong enough to support your theme (15 core scenes).
I suggest using the same diagnostic questions if you want to analyze the narrative of your concept album, but if you want to analyze a single song, you have to change your approach.
After all, a song is not a novel.
To determine the strength of storytelling in your lyrics, use an adjusted version of the Story Grid Spreadsheet. Here you can collect all your songs of each album and your entire discography to determine the storytelling strength of each album.
How to analyze your discography?
1. Analyze the songs and fill in the spreadsheet
Info: This is the short version of my process. If you are interested in seeing the full step-by-step guide of how to analyze songs and discover the Uniqueness Factor, visit my website: storiesinsongs.com/placebo.
When you analyze a scene in a novel, one of the most important things to look for is a turning point – the moment in a scene that turns the tables for better or worse and throws the character into a crisis.
1.1 Find the problem the character faces
If you consider a song to be the same as a chapter in a book or a scene from a movie, then something needs to happen in the song. When I analyze a song, the first thing I look for is does the character face a problem in the song? Because he must be trying to accomplish something or solve a problem in order for something to be happening.
Including a problem in a song that the character has to deal with is one of the most critical factors to find out if the song is telling part of a story, or if it’s just a snapshot of a single moment in time in which nothing happens.
If the song addresses a problem, the character in the song needs to find a solution to the conflict he faces. That’s his goal. And in every story, the main character needs to WANT something. Otherwise, the audience isn’t invested in hoping the character reaches (or doesn’t reach) his goal.
- In “I’d Do Anything for Love” by Meat Loaf, the character in the song wants to prove his love. He faces the problem that his love interest doesn’t trust him and thinks he would cheat on her. So he has to make it clear to her that he would do anything for HER love, which excludes her worry that he would fool around with other women to satisfy only his sexual desires.
1.2 Find the turning point
After knowing the problem the character in the song deals with, I look for a turning point. Sometimes that moment is just hinted at, and we skip right to the decision. The same goes for the inciting incident. If it’s a love song about a break up (the breakup moment being the turning point), the inciting incident is (anything the lyrics refer to) how the relationship was before the breakup. Sometimes there’s a clue to either a naive protagonist, made mistakes, rivals, …
Looking for a problem the song deals with and finding the turning point are the two most important things you need to identify to get a better understanding of the character in the song and his situation.
1.3 Criteria for the spreadsheet columns
Since you are familiar with the Story Grid, I won’t go into each storytelling criterion that I answer in the spreadsheet. But here’s a list of what I especially take note of:
- band
- song title
- writers
- the first line of the song
- the last line of the song
- What is the song about (one-sentence summary)
- What is the problem the song deals with? Has it been answered, and if yes, in a helpful way?
- Is the song a cautionary tale or a prescriptive one?
- If the song belongs to a larger story, what genre would it be? (external and internal)
- What are the obligatory scenes and conventions of the external and internal genres that were mentioned in the song (list external and internal separately)
- What’s the message of the song? And is it clear?
- What kind of person is the character? Do we like him?
- Does the song have a turning point?
- What are the five commandments?
- What’s the external and internal value shift?
2. Do the math and create infographics
After gathering the determined information about each song and filling out a spreadsheet with your collected data, you could leave it at that.
After all, you would have a detailed overview of each song. And any empty columns would tell you what’s missing.
But to compare the albums or single releases to the factors of success like chart position or album sales, it’s best to visualize the results.
Seeing the results will help you find patterns.
And by listing each album’s result in a graph with the factors of success (album sales, chart position) will give you a better understanding of which criteria influenced your sales.
Example Westlife
For example, let’s look at Westlife’s discography and see if having a turning point in the songs influenced the sales of their albums.
To do this, you need to calculate the average (%) of how many times the songs on the albums fulfilled the selected criterion.
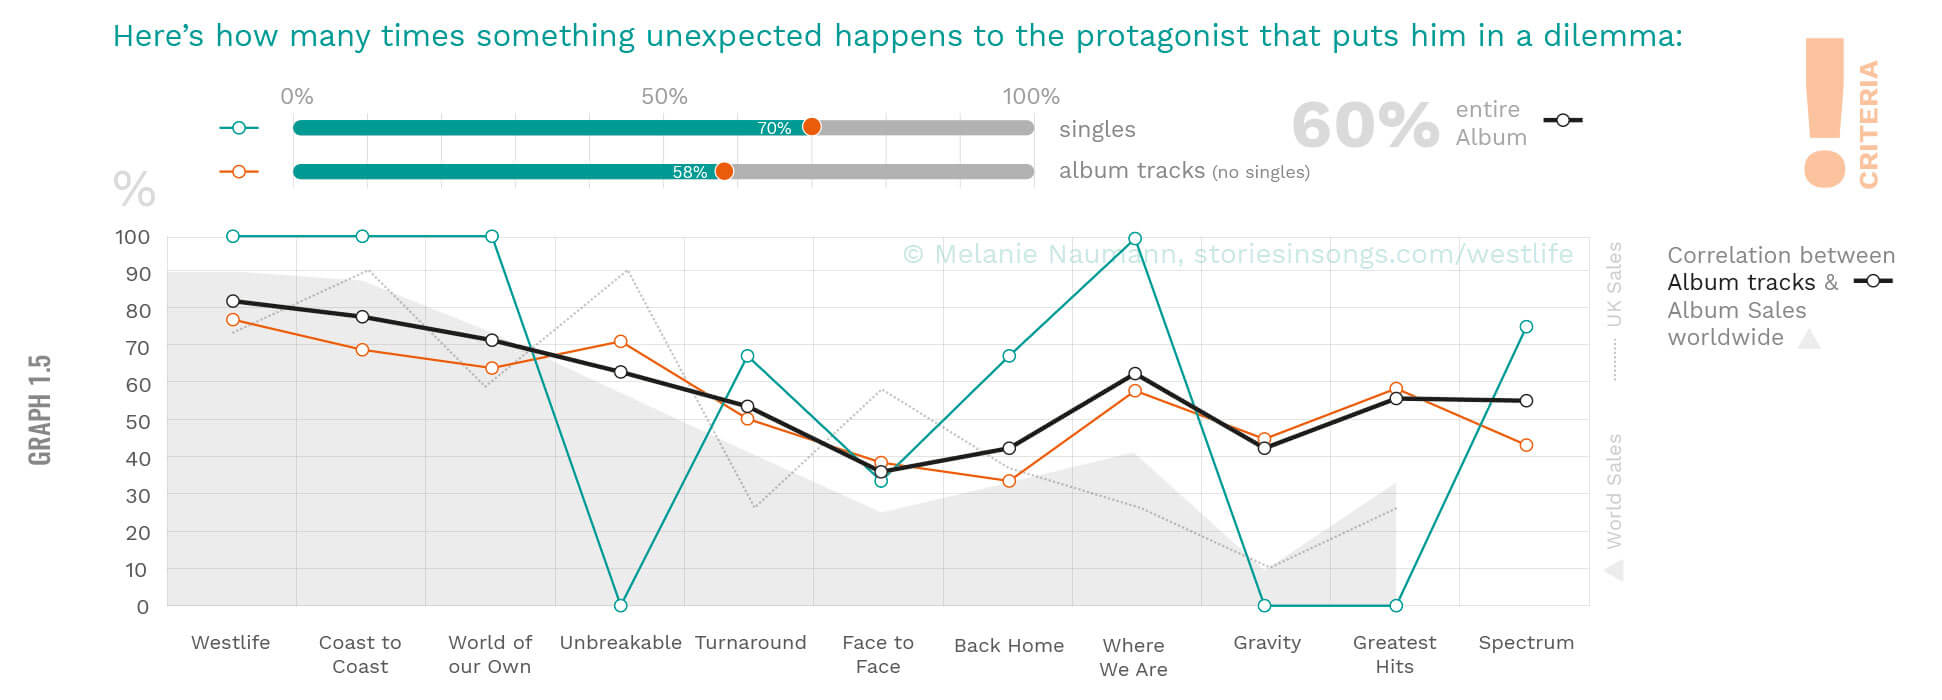
Above, in graph 1.5, is the Westlife graph for comparing the albums with each other as well as with the chosen factor of success (UK and worldwide album sales).
The first graph shows that 70% of the single releases have a turning point while only 58% of album-only tracks have turning points. The average of the entire album is 60%.
The second graph above shows the average result for all of Westlife’s albums including the entire album (black line), the single releases (green line), and the album-only tracks (orange line) for the same turning point criterion.
You can see there’s a correlation between the album’s worldwide sales and having a turning point in the songs.
Info: If you want to see the complete infographic with many more graphs to the different storytelling criteria, you can download the comprehensive Westlife Infographic here.
3. The Uniqueness Factor
Bands are categorized by the type of music they play on their albums and what their songs are mainly about. And their fans expect to hear that type of music on their future albums, too.
If a heavy metal band suddenly released a pop-punk album, their fans would likely be disappointed. Because listeners turned into fans for two reasons:
1. The band played the kind of music they liked metal, (country, pop, rock, rap, …) and
2. they connected with what their songs were about (lyrics).
Bands like Westlife are known for singing only love songs.
Placebo focuses on the internal turmoil of their characters who deal with external problems. And Green Day’s songs are a rebellious force against authority.
Every band that has released a couple of albums creates a musical fingerprint – a unique signature to what their songs are about.
I call this musical fingerprint the Uniqueness Factor.
The Uniqueness Factor is the final result of the complete song analysis of a discography that will tell the musicians/songwriters exactly what the three most important storytelling criteria are as well as what their listeners expect from their lyrics.
How to find the Uniqueness Factor
I use Westlife as an example to show you what their Uniqueness Factor is.
1. Follow the next steps to find out how you can discover this musical fingerprint.
- First of all, we need to have completed the previous three steps:
- 1. Analyzed each song and completed the spreadsheet
- 2. Calculated the average result of each storytelling criterion for every album (= one graph for each column in the spreadsheet)
- 3. Created infographics to visualize the results
- The next step is to calculate the overall average (%) for each storytelling criterion of the entire discography. That means of all the songs that were analyzed.
- Put the average of each storytelling criterion of the complete discography into one graph (graph 4.1). If you want to know how single releases differed from the album-only tracks, you can also add their average result of the complete discography.
Below is the graph for Westlife’s complete discography:
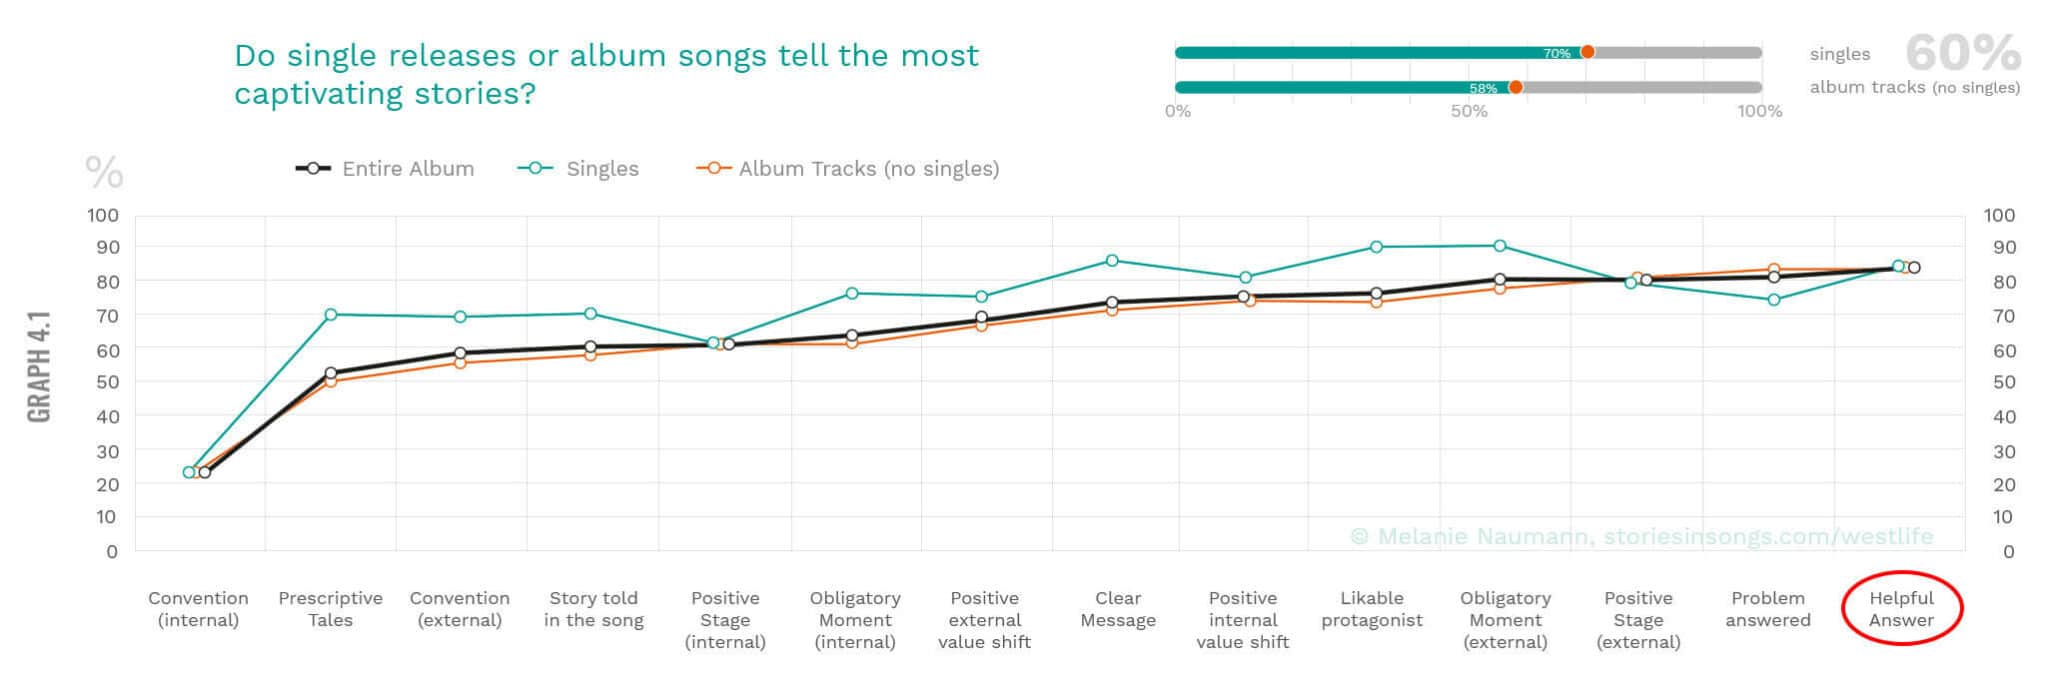
In the graph, I have reordered the criteria (different order than the spreadsheet) to make it into one ascending line. You can see that single releases are usually above average while the album-only tracks are entirely in line with the general feel of an album.
This line tells Westlife (and each musician you do an analysis like this for), that what their fans value the most is hearing a solution to the problem the character faces in the song. So whenever Westlife writes a new song, they should pay attention to fulfilling this expectation. Because this criterion belongs to the promise they’ve made to their fans over and over again: Listen to our love songs because they will help you deal with and solve whatever love problem you struggle with.
Even though this line tells you the average of how many times you need to keep your promise to each storytelling criterion on a new album, there are still those criteria that have a proven impact on an album’s success and which are the most important to keep.
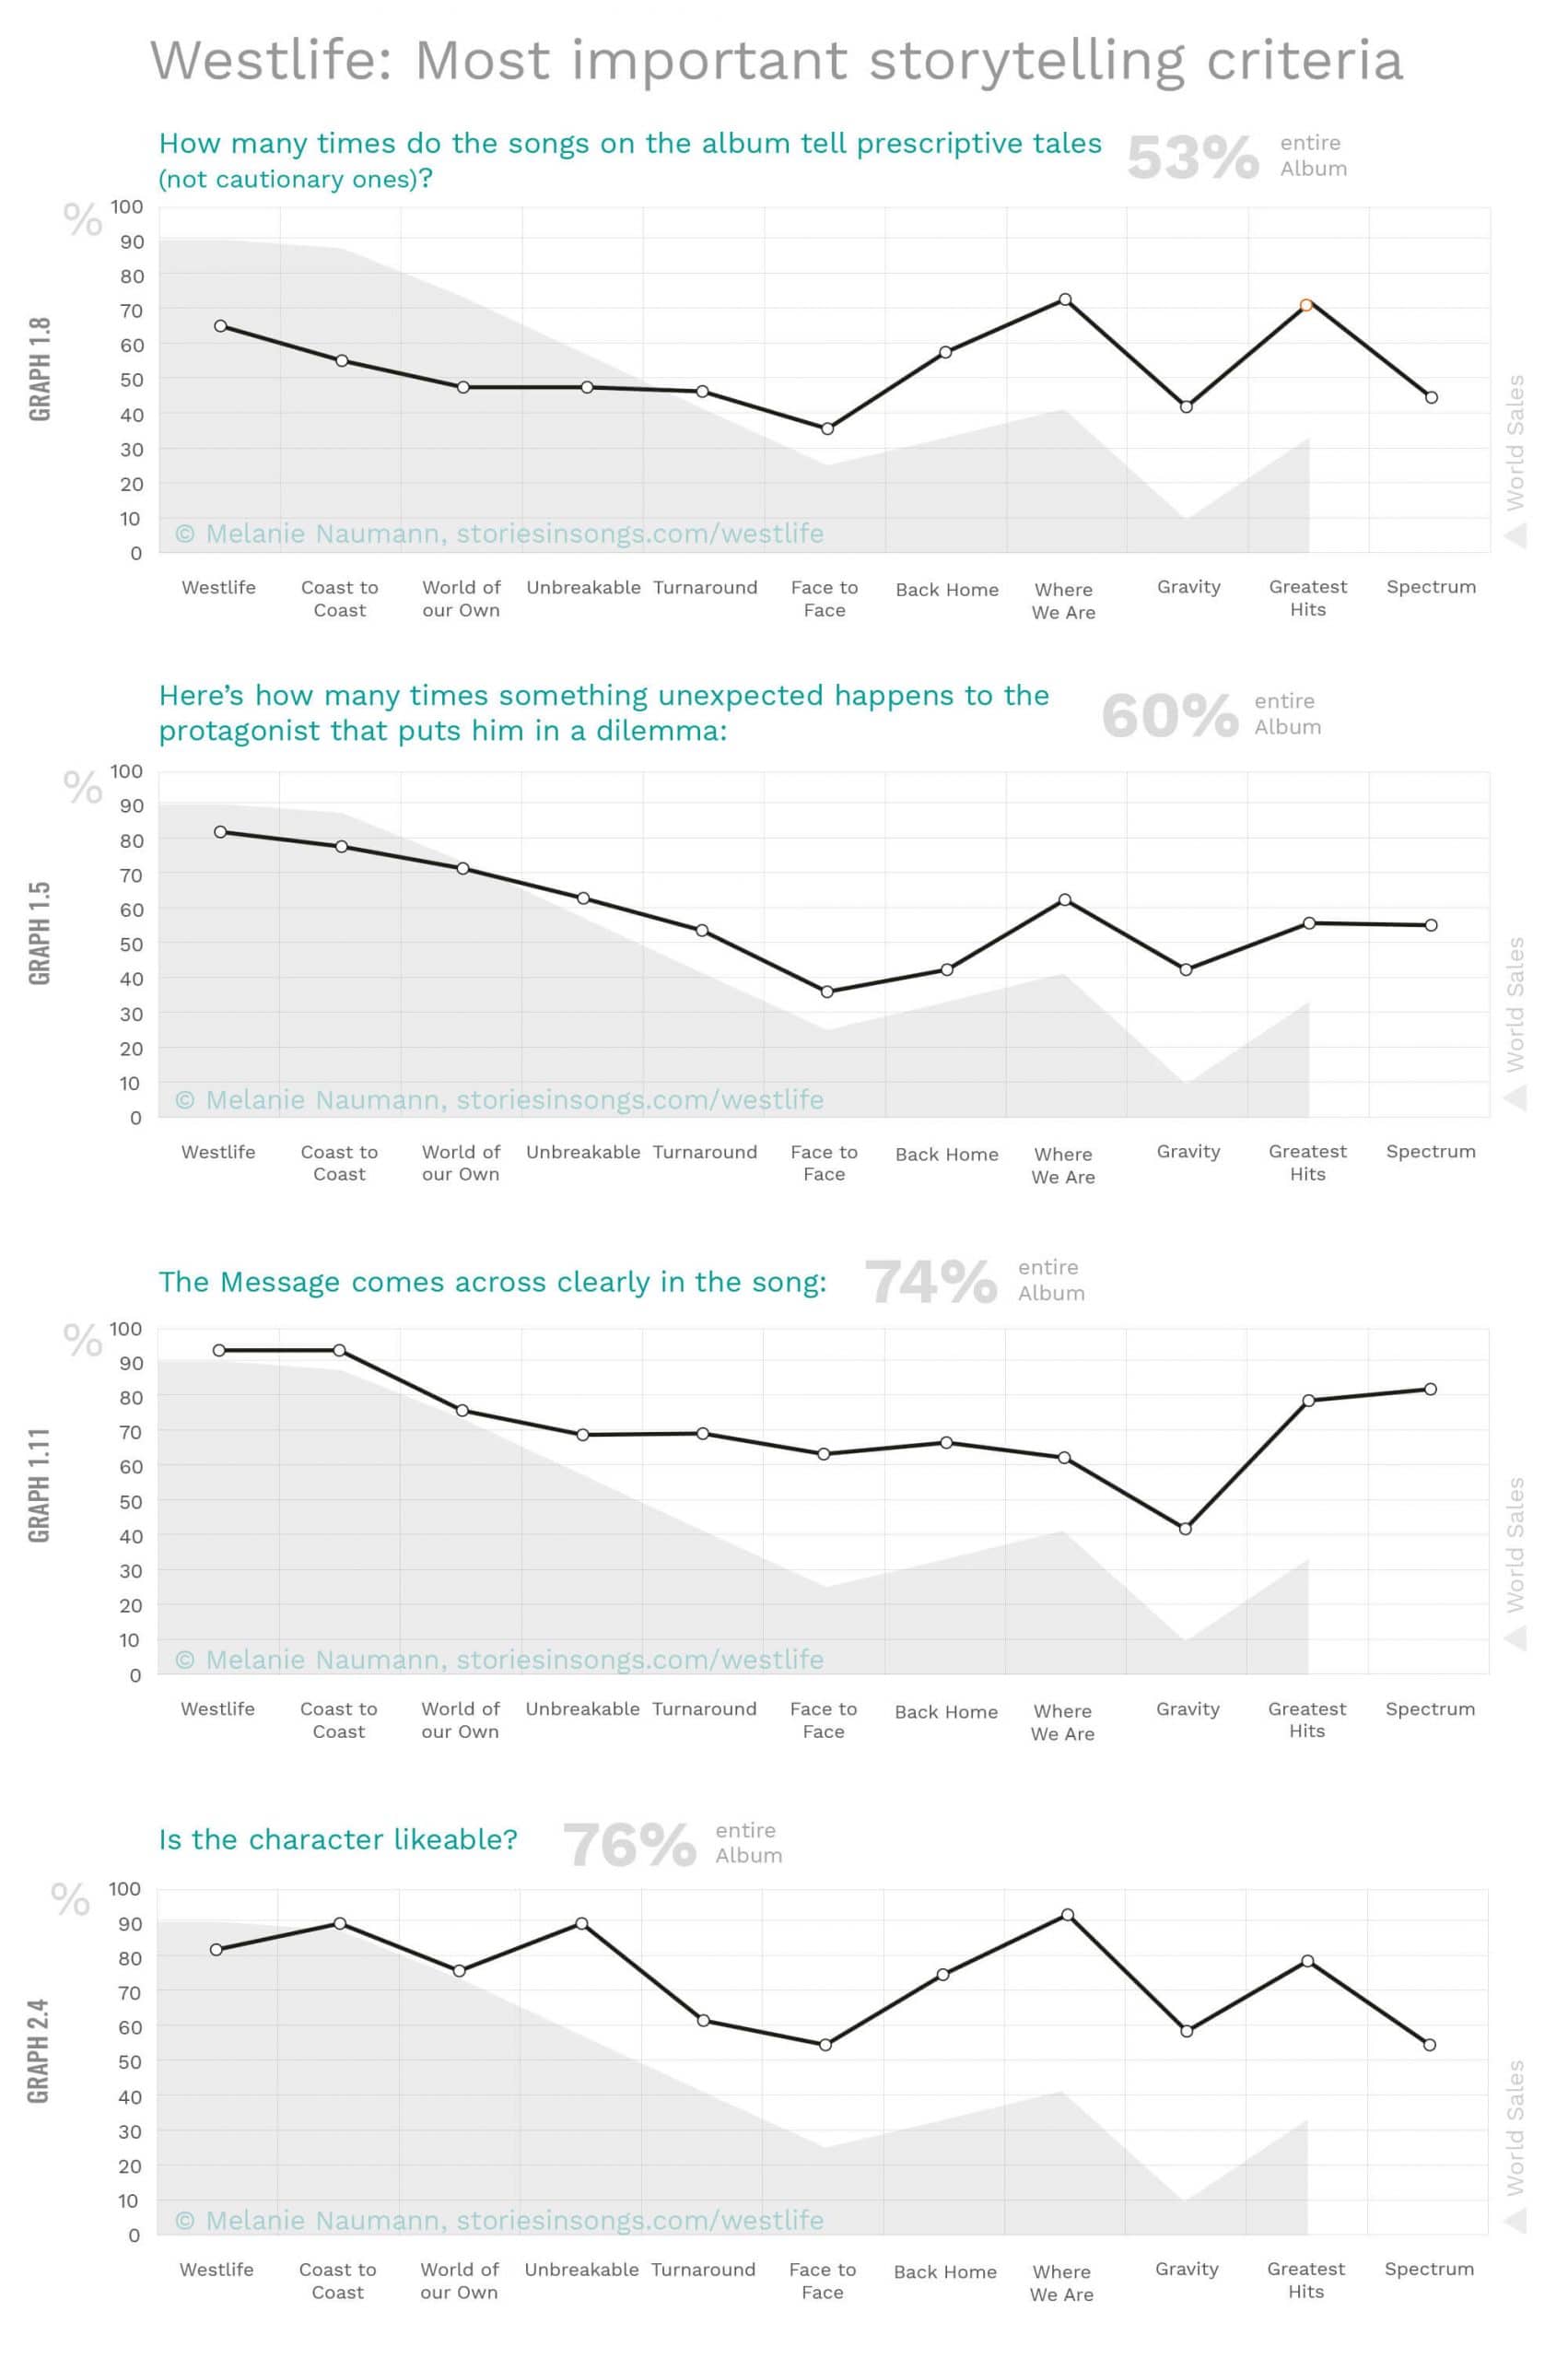
2. Find the most important storytelling criteria
That’s why we need to create the graphs for each storytelling criterion (every column in the spreadsheet) to find out what are the most important storytelling criteria for the success of Westlife’s albums.
We find those criteria when there is a correlation between that criterion and the chosen factor of success (album sales or chart position).
Here are the criteria that have the most impact on Westlife’s success (compared to the worldwide album sales):
3. Compare the albums to the fans’ expectations
Now that you know the most relevant criteria, you can take graph 4.1 and use the average of each criterion of the complete discography as a reference point to compare the album to it.
That will help you find out which album fulfilled the expectations of the fans and which one did not.
When you put every album’s average of each storytelling criterion into the chart, the graph will look like this:
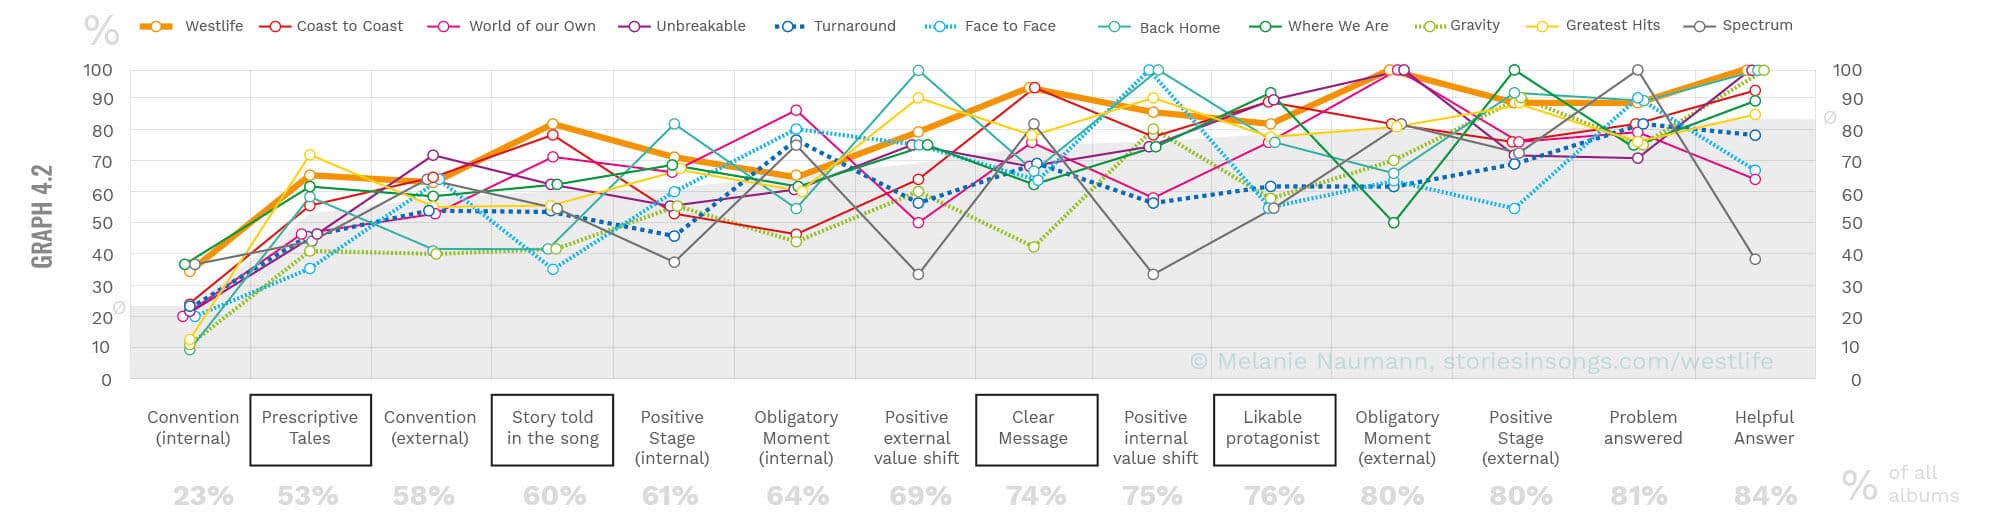
This graph will let you see which albums followed the ascending line of the fans’ expectations and which ones went on a completely different path and therefore are not a kept promise to the listener.
Remember the first graph I showed you about the storytelling strength of Westlife’s album that I compared to the worldwide album sales?
It looked like this:
So now, there is one graph that shows you the Uniqueness Factor (graph 4.2) and one that visualizes the general storytelling strength of each album (graph 4.4).
All you need to do now is cross-check if the Uniqueness Factor of the band is truly the secret formula to their success.
So take graph 4.2 and check how many times an album fulfilled the average of each criterion, and how many times it did not stray more than 10% over or below that criterion (that means it still kept the promise). If you got those two numbers, you take their average (black line in the following chart):
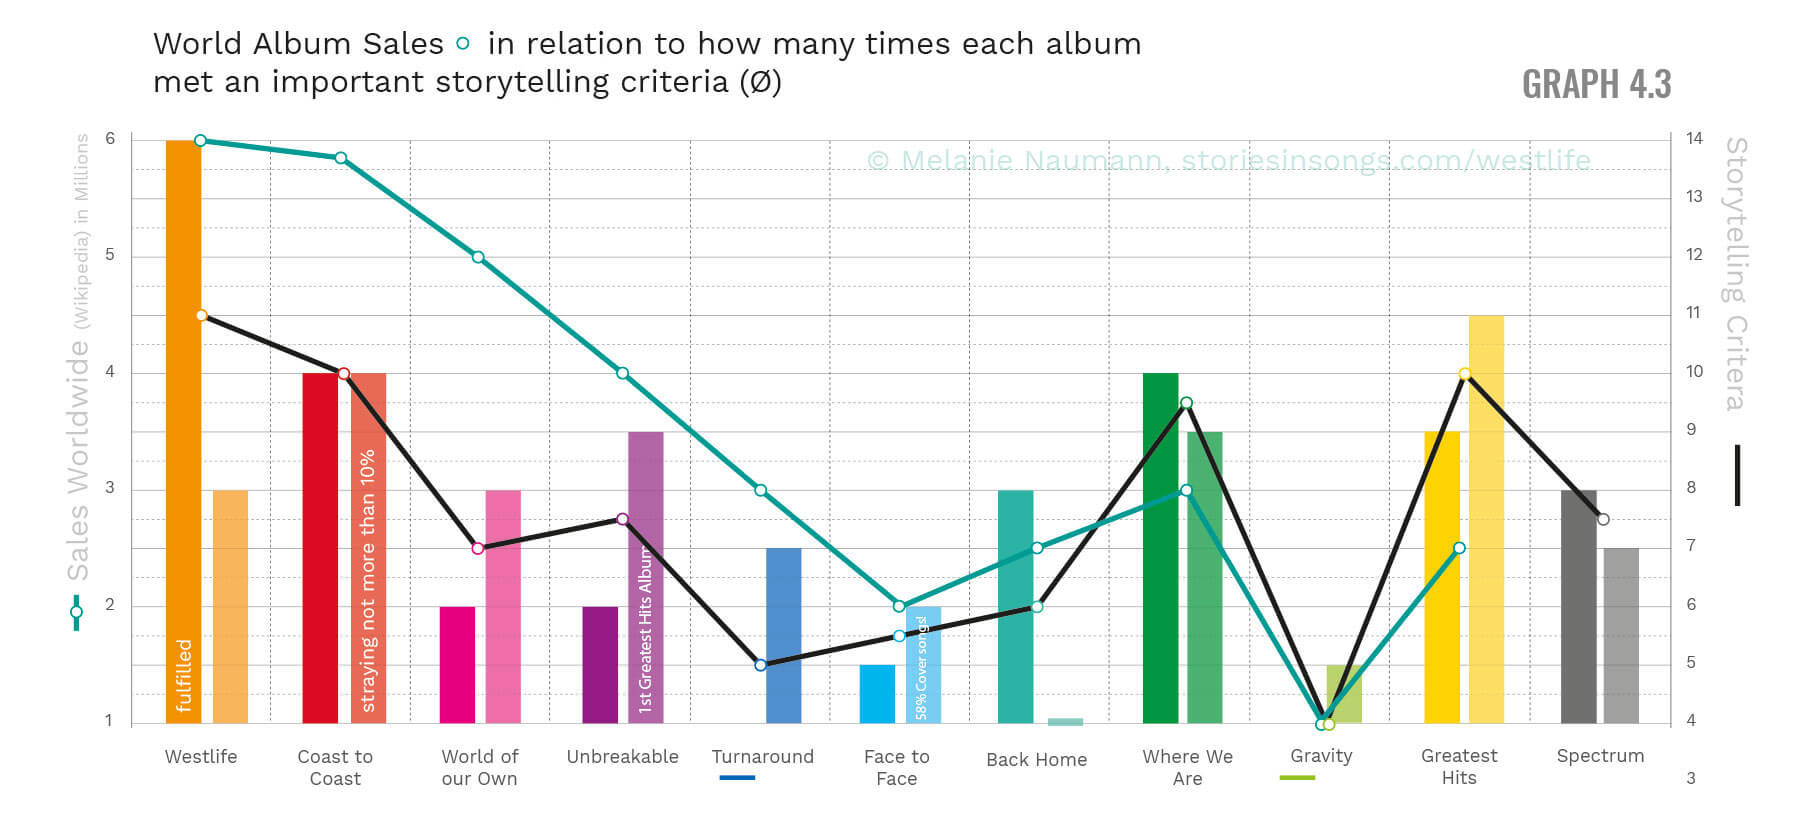
Once again, you can see why storytelling in songwriting matters.
Graph 4.3 proves that every album that fulfilled the expectation of the fans sold better than those that did not. And in order for Westlife to write the next best-selling album, they need to consider the promise they’ve given their fans (average of complete storytelling criteria) and pay the most attention to those criteria that has a proven impact on their success (see graph: Westlife: Most important storytelling criteria).
Westlife’s Uniqueness Factor
So Westlife’s Uniqueness factor looks like this:
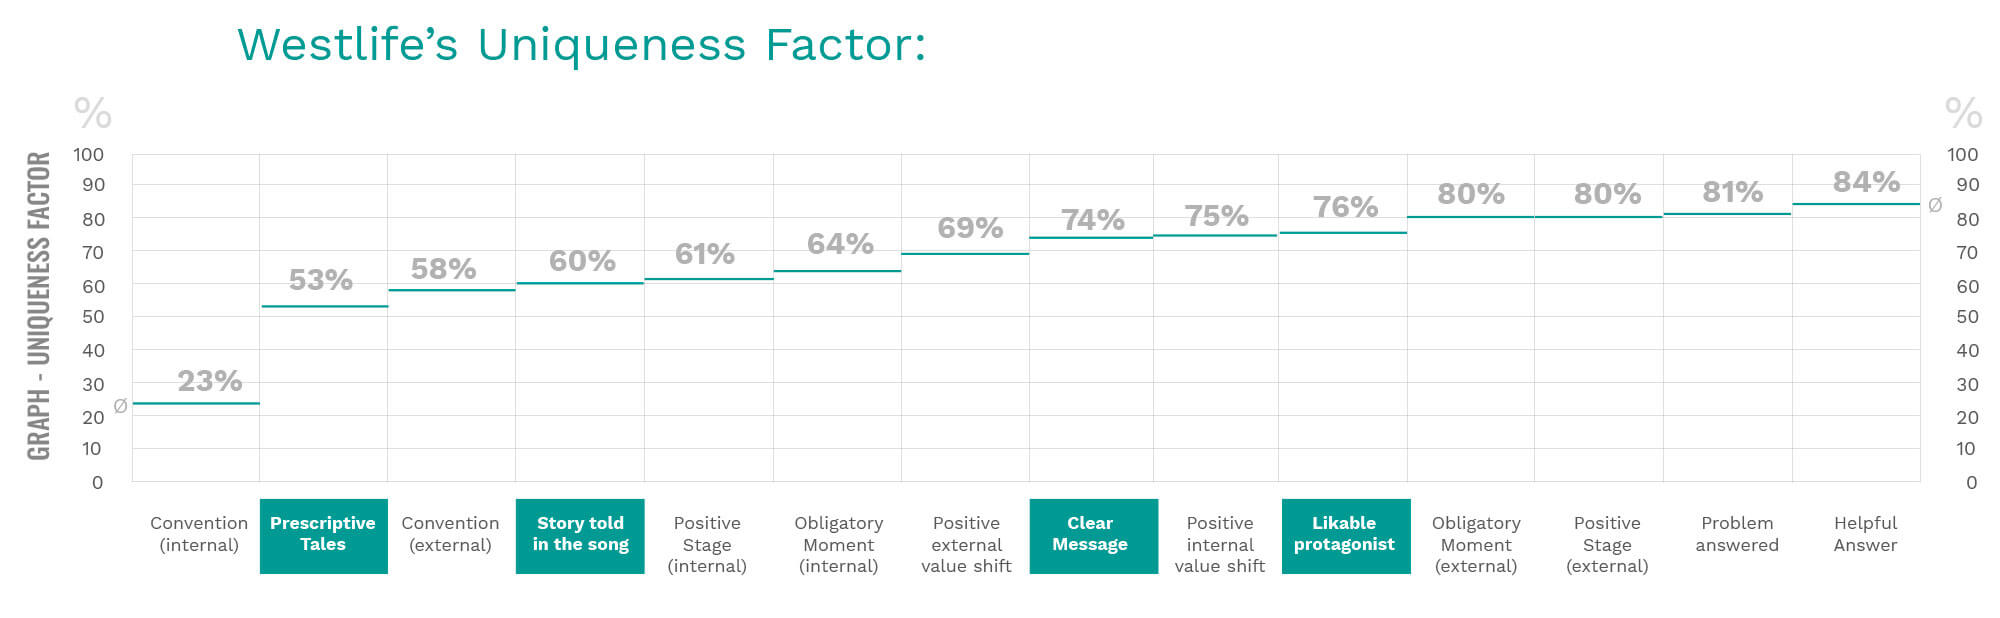
It’s the overall average of their discography for each storytelling criterion as well as the most influential storytelling criteria that have a proven impact on the worldwide album sales.
If Westlife manages to write the songs of their next album so that they correspond with their Uniqueness Factor, the chances of the album selling well increase. (Of course, the music also needs to do its part).
The Uniqueness Factor in Action:
Now to find out why Westlife’s first album is still their most successful one, you need to compare it to the one album that sold the least: “Gravity”. And then focus on the course of those two lines:
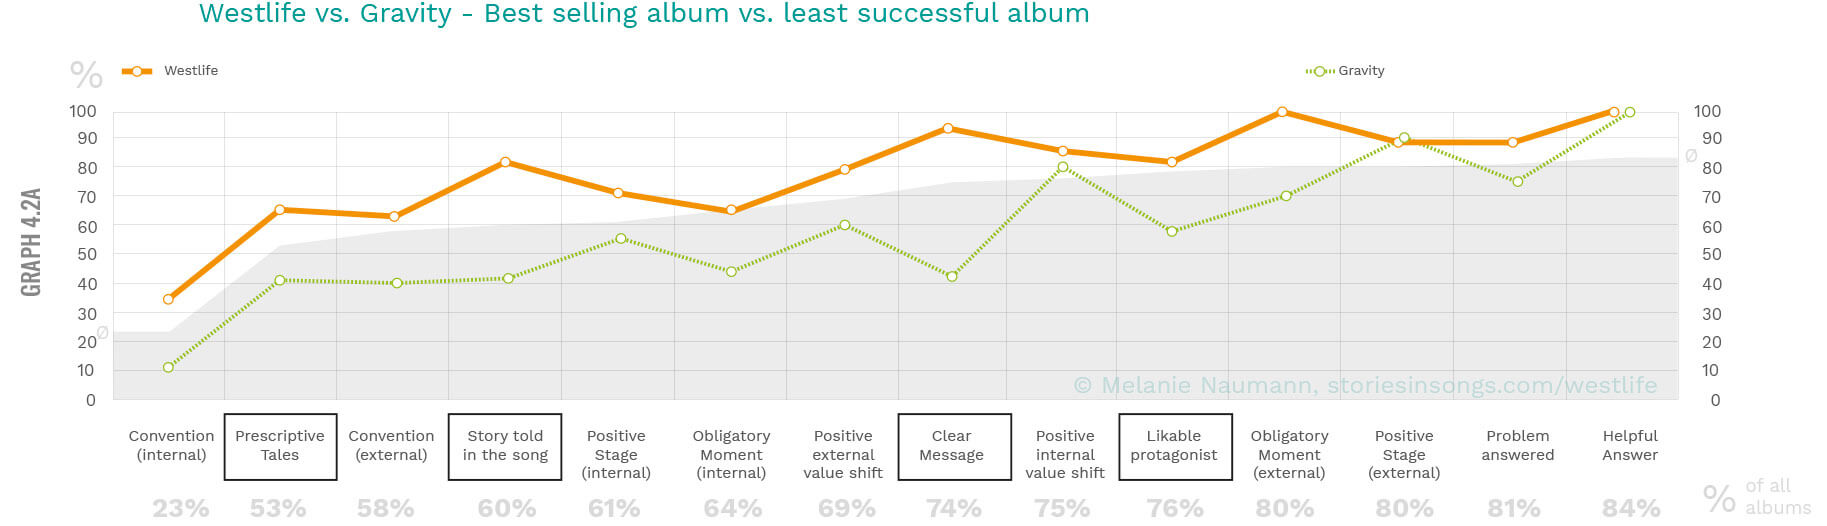
“Westlife” is their best selling album because it follows that ascending line of the fans’ expectations the most without deviating from the path, and it meets or exceeds the storytelling criteria for a great love story told in a love song (on Westlife’s standards).
If you look at “Gravity”, you can see that this album strays the furthest and takes on a completely different path from what fans were expecting of Westlife. It just did not deliver. Especially, it was below average in the storytelling criteria that are crucial for Westlife’s success.
Placebo
If you think this is just a coincidence, let’s look back at the seven studio albums of Placebo.
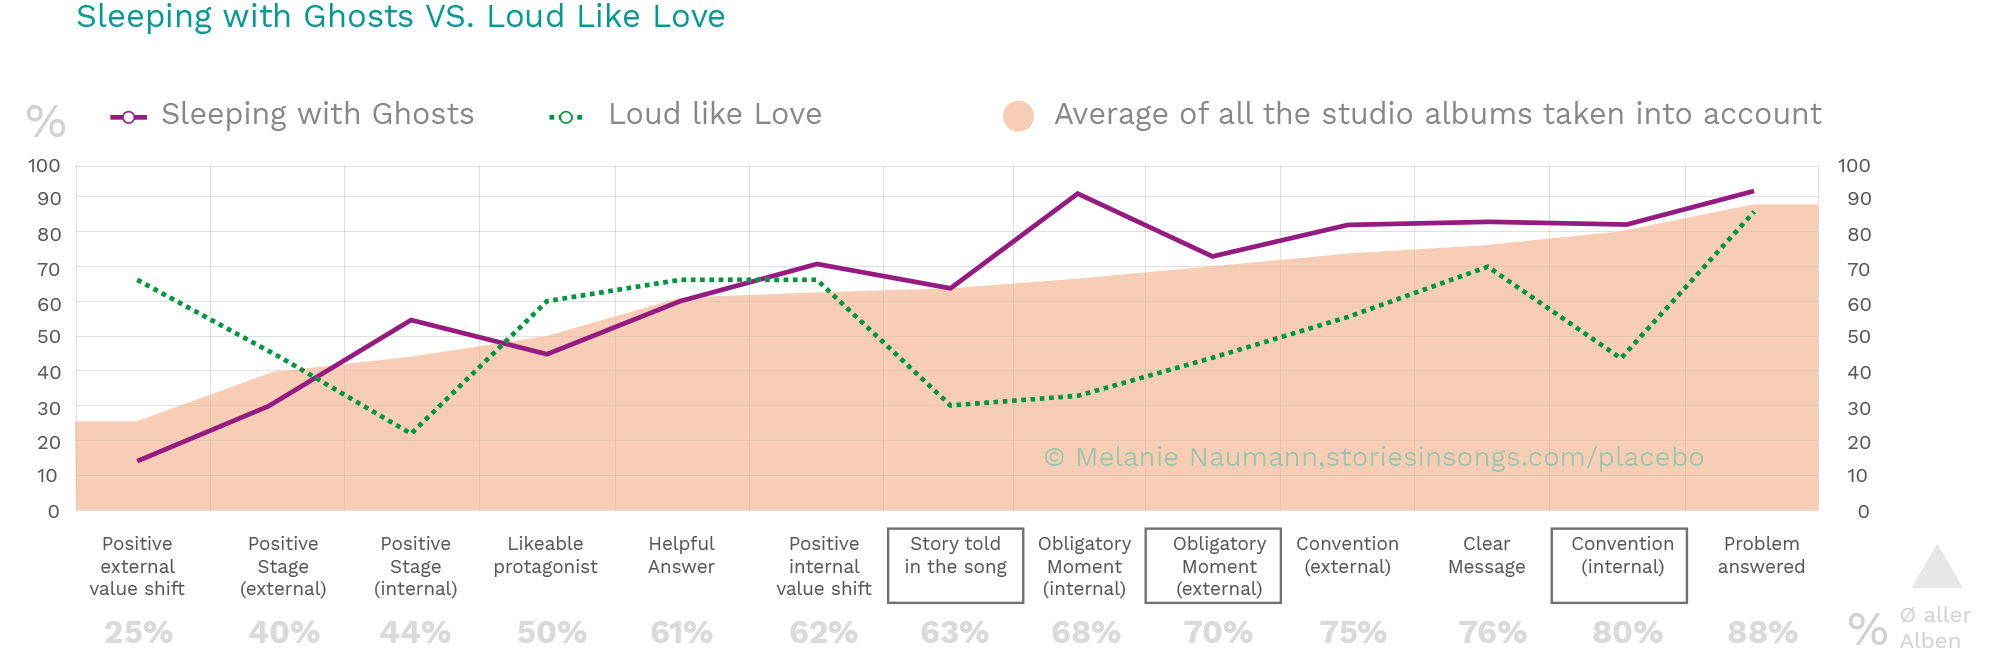
We know from the graph at the beginning of this post that “Sleeping With Ghosts” had the highest sales in Europe while “Loud Like Love” was their least successful album.
Now, if we compare those two albums with the average for each storytelling criterion, we once again see that “Sleeping With Ghosts” followed the ascending line of the fans’ expectations (orange background). On the other hand, “Loud Like Love” took on a completely different path and did not fulfill the promise that Placebo’s fans wanted to be kept.
And here’s another chart that proves the theory about how much lyrics influence the success of an album. This is a similar chart as Westlife’s graph 4.3 that shows how many times an album of Placebo fulfilled the average of each criterion, and how many times it did not stray more than 10% over or below that criterion:
The key to discovering a band’s Uniqueness Factor is not only using the Story Grid spreadsheet as a great tool to analyze the storytelling strength of each song, but it’s also about turning the collected data into visual assets in order to make comparisons and find patterns.
What about creative freedom?
This analysis is not intended to put any restrictions on a musician or a band. It’s there to help them see why people connected with their songs, became their fans, and what makes the lyrics of their songs so unique.
Knowing which storytelling criteria influenced their success and what fans expect to hear from them is not putting their creativity in chains, but it’s to pool their strength to be even more successful.
Musicians who struggle with delivering another best selling album or who don’t want to disappoint their fans can profit from the Uniqueness Factor Analysis.
So that whenever they write a new album, they know what the lyrics of their songs need to include to satisfy their audience’s expectations, and to make their new album sell well!
If you have any questions or comments, please post them in the comments below.
If you are a musician or a band and you want to work with me, you’ll find my services here: https://storiesinsongs.com/work-with-me/
Thank you, Melanie.
Links:
- Six Core Question Analysis of My Chemical Romance’s song “Welcome to the Black Parade”
- Case Study Placebo: Step-by-Step guide to discover your band’s Uniqueness Factor
- Infographic Westlife
