Now that we’ve reviewed the five fundamentals of Story form (Inciting Incident, Progressive Complications, Crisis, Climax and Resolution) and the six units of Story (Beat, Scene, Sequence, Act, Subplot and Global Story), let’s take a step back to the very beginning of why this website exists in the first place.
What does an editor do the minute a manuscript that he’s commissioned lands on his desk?
Let’s assume he’s already read it.
The Story isn’t working quite yet.
It’s close, but it’s vaguely disappointing.
There is no easy fix that comes into his mind. He knows that he’ll have to do a comprehensive analysis of the work before he’ll be able to give the right diagnosis and provide suggestions capable of helping the writer fix the problems.
The first editorial stage is to pull up a fresh Story Grid Spreadsheet and fill it in. This is no small task, but it is crucial to take a book that doesn’t Work to one that does.
As we are leading up to The Story Grid for The Silence of the Lambs, let’s create The Story Grid Spreadsheet for it too. So in the next few posts, we’ll walk through the data points on The Story Grid Spreadsheet column-by-column and row-by-row. These data points, when combined with The Foolscap Global Story Grid, will ultimately generate that very strange-looking infographic I shared with you at the very beginning of this website, the one that looks like a sine/cosine graph on the resources page. As an aside, the final version of The Story Grid for The Silence of the Lambs is even more wonky and jam packed with info than my original. I’m in the final throes of design and layout for the book and I gotta tell you, it’s really cool. As soon as it’s ready, I’ll post it in the resources section too.
By the time we’re through with the Spreadsheet, you’ll be able to walk through The Story Grid from left to right, from top to bottom and everywhere in between and intuit exactly how Thomas Harris created such an amazing Story.
We’ll get there, I promise. It’s the Ending Payoff of this long series and of the book.
I have to confess at this very moment my blood is pumping. I’m excited. For a Story nerd, there is nothing more appealing than figuring out how a master writer put together his masterpiece.
So next up is the explanation for the first three columns of The Story Grid Spreadsheet for The Silence of the Lambs.
Just for fun, here’s is the first two page spread that will be in the book.
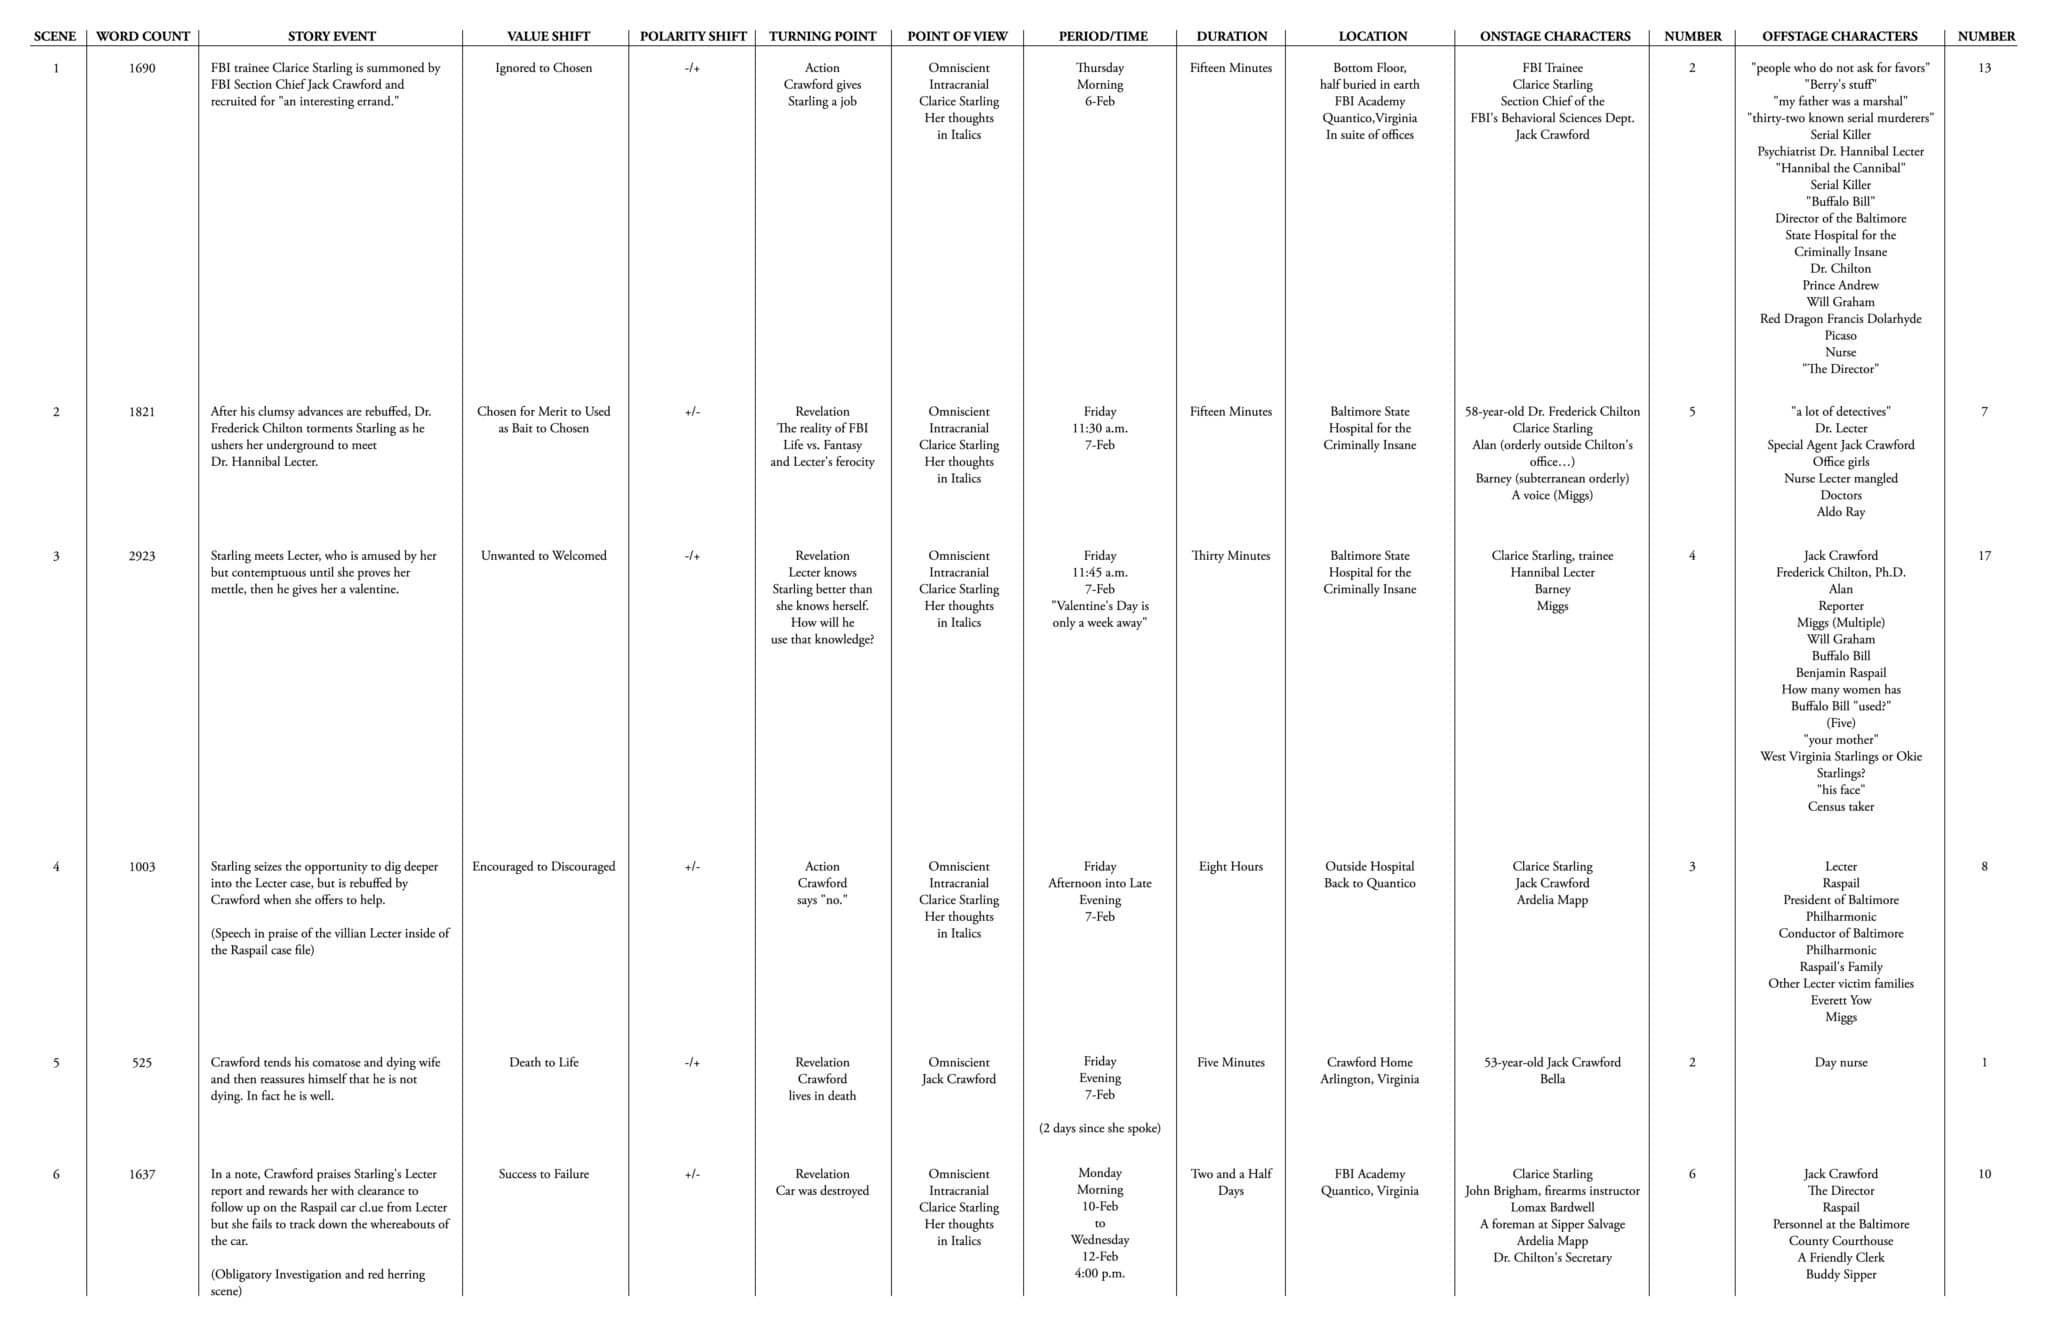
Here is the first page of The Story Grid Spreadsheet for The Silence of the Lambs
For new subscribers and OCD Story nerds like myself, all of The Story Grid posts are now in order on the right hand side column of the home page beneath the subscription shout-out.
